ezcGraph introduction article
First published at Wednesday, 10 January 2007
Warning: This blog post is more then 19 years old – read and use with care.
ezcGraph introduction article
My article about an introduction to ezcGraph was just published on ez.no. From the article:
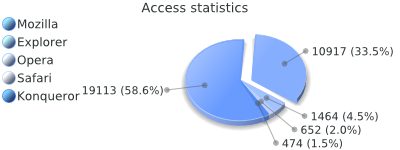
 Simple 3D pie chart
"Among the additions to the latest eZ Components 2006.2 release is the Graph component , which enables you to create bar, line and pie charts. The output driver mechanism allows you to create different image file types from each chart, and the available renderers make the chart output customizable from simple two-dimensional charts to beautiful three-dimensional data projections. "
Subscribe to updates
There are multiple ways to stay updated with new posts on my blog:


