ezcGraph 1.1.1 released
First published at Tuesday, 14 August 2007
Warning: This blog post is more then 19 years old – read and use with care.
ezcGraph 1.1.1 released
We just released ezcGraph 1.1.1 - containing some small bugfixes for the prior release 1.1. The 1.1 release of ezcGraph release with eZ Components 2007.1 contained several interesting new features not yet described here.
Radar charts
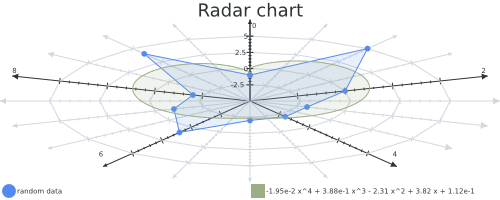
As toby already blogged earlier this year, we now support radar charts, which was not hard to add to ezcGraph because they are more or less line charts, just with rotated axis for each step on the original x axis in line charts and using a polar coordinate system instead of a cartesian coordinate system for the data points. This way also all data sets work with radar charts, which work with the other chart types - even if polynomes are quite hard to recognize in a polar coordinate system.
 Radar chart with polynomial average data set
The source of this example.
Numeric datasets & logarithmical axis
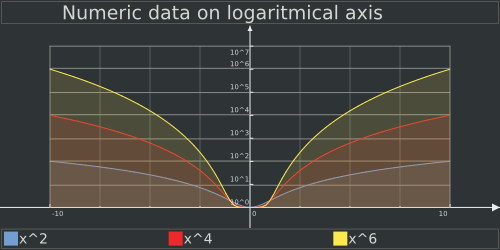
The general support for mathematical charts was enhanced by support for numeric data sets, where you just pass a callback (which of course may be a function defined by create_function()) and define a value range. Together with the logarithmical axis you should be able to use it for your mathematical stuff quite well.
 Line chart with logarithmical axis and numeric data set
The source of this example.
Rotated texts on axis
If you are required to display a lot of values on one axis you normally want to stack them tigther by rotating them. This is also possible since the last release and of course documented in the tutorial decorated by a nice example output of this feature.
Helper functions for interactive charts
It was possible with the release before, but in the current release we added convenient helper functions to easier make the charts interactive. You just need to add a value to the URL property of your data set or data points and call the appropriate helper function from the tool class and you get an interactive clickable chart.
The source of this example. This also works with the GD driver, but then the tool method would return HTML for an image map you would need to include in your source. With SVG just some ECMAScript is added to the XML.
Other improvements
There are a lot of other improvements and bug fixes and I do not want to mention them all here, but those are perhaps also interesting for you:
Fixing border issues in drivers
The different output drivers we are supporting with ezcGraph all have different interpretations where to place a border. A border of some width may be placed in the boundings of the virtual border, centered on on the virtual border or outside.
For this we developed and implemented algorithms to reduce the size of all used shapes and correctly draw the border in every case. With some edge cases, like very small angles in polygones or circle sectors, this maybe is not the easiest thing to implement / understand and you may want take a look at our BSD licensed code and use it, if you run into similar problems.
Better date support in dateTimeAxis
Since the last release we support unregular step / tick sizes on all axis, so that we are able to draw months and years (which may vary in length) on all axis and also use this for more efficent reducement of step counts when having a prime number of steps on your labeled axis etc. Since this can't work with some chart types, like bar charts, you may get an exception when you try to combine those features.
Subscribe to updates
There are multiple ways to stay updated with new posts on my blog:


